
Azure environments can get very complex, especially when managing hundreds of resources spread across different subscriptions and resource groups. Proper tagging of resources is crucial for efficient management, cost allocation, and accountability. Tags like Owner, Environment, Cost Center, and Application Name can bring clarity and structure to your Azure landscape. However, it is easy to make typos or use different capitalization. When tagging environments, “dev” is not the same as “Dev” or “DEV”, etc., so you need to create an inventory of Azure Resource tagging to get insights into the common challenge of inconsistent or missing tags.
Overview
In this blog, we walk you through how to build an inventory of resource tagging in your Azure environment, the challenges you may encounter, and how to use powerful tools like Azure Graph Explorer, Kusto Query Language (KQL), and Excel to query, analyze, and export the tagging data.
The article has the following topics:
- Using Azure Resource Graph Explorer for current tag analysis
- Handy KQL statements and operators
- Creating and running sample KQL queries
- Exporting query output to Excel for further analysis
Using Azure Resource Graph Explorer for Inventory of Azure Resource Tagging
The Resource Graph Explorer lets you use Azure Resource Graph to query Azure resources. In contrast with many other views in the Azure portal, the Resource Graph Explorer can query across subscriptions, making it invaluable for gathering insights into your current tagging landscape.
How to start using Azure Resource Graph Explorer
To start using the Azure Resource Graph Explorer, follow the below steps.
- Open the Azure portal (https://portal.azure.com).
- In the Search box, search for Resource Graph Explorer and select it when it appears under Services.

The above screenshot shows the most essential sections of the Resource Graph Explorer.
- Subscription – Here, you can select which subscriptions must be considered with your queries.
- Categories/Tables – By choosing a category or a table, a where clause is added to the query (see 5). For example, if you select Integration/Logic Apps, the where clause
type == "microsoft.logic/workflows"is added. - New/Open query – Here, you can create a New query or Open an existing one. Any New or Opened queries will show up on separate tab pages.
- Run/Save/Save as – Choose to Run the current query, Save it, or Save an existing query with another name.
- Query interface – Enter your queries here. The interface has intellisense, which makes it easier to enter your queries.
- Get Started/Results/Charts/Messages – The Get Started view contains predefined queries you can use. The Results view shows the output of query executions. In case your query contains summaries and counts, the output can be found in the Charts. The Messages view shows information about query execution.
- Download as CSV – Download the query output in CSV (comma-separated) format for further analysis in Excel.
- Formatted results – Enable this button for better readability of the query output.
Executing a simple KQL query
To query against Azure resources, you enter your queries in KQL (Kusto Query Language). A basic query to retrieve resources might look like:
Resources
| project name, resourceGroup, tags
This query gives you a view of the resources, their associated resource groups, and any tags currently applied.
In the next section, we have a better look at the KQL query language.
Handy KQL Statements and Operators
Coming from a SQL Server background, I am comfortable writing SQL queries. However, because KQL is a crucial query language in Azure, I wanted to learn it better. Although I struggled initially, I increasingly like the language and recognize some of its benefits over the (T-)SQL syntax.
This section focuses on the KQL statements and operators that help us identify missing and inconsistent tags in your Azure environment.
KQL is a read-only query language that retrieves and processes data from Azure. It’s designed for powerful filtering and data analysis, making it ideal for querying your Azure resources. The language is structured around the concept of tabular data, where each query operates on tables and returns tabular results.
Let’s have a look at several often-used elements:
The project operator
With this operator, you select specific columns from a table. For example, the table resources contains several columns you might not be interested in. If you run the following query:
resources
KQL returns all the columns (and records) in that table. However, you might only be interested in a couple of columns. In such scenarios, you use the project operator to show just the columns you are interested in.
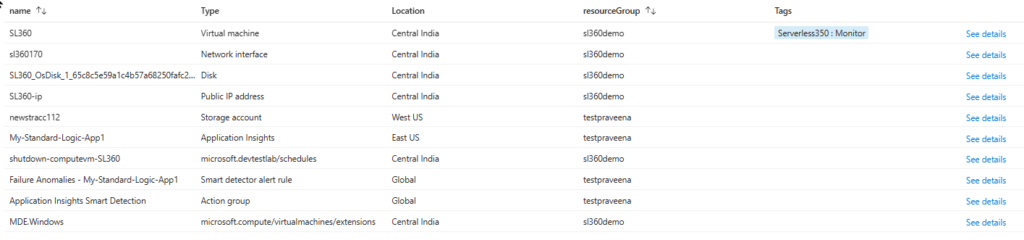
The below query shows all records of the resource table, but just the columns name, type, location, resourceGroup, and tags.
resources
| name, type, location, resourceGroup, tags
The formatted result may look like the one below.
You can also have a table with, say, 20 columns, but you want to see only 15 of them. In that case, it is inefficient to project all the columns you are interested in. With KQL, you can use the project-away operator to list the columns you are not interested in.
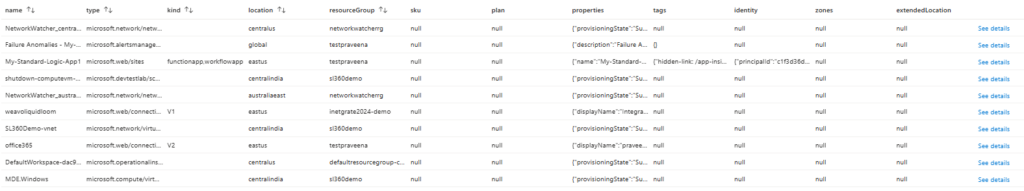
The below query shows all records of the resources table, but instead of showing all columns, it leaves out the columns id, tenantId, subscriptionId, plan, and managedBy.
resources
| project-away id, tenantId, subscriptionId, plan, managedBy
Now, the formatted result may look like:
In summary, you have the following options to decide what columns you want to show in the output of a KQL query.
| What to show | Pseudo query | Example |
|---|---|---|
| all columns | table name | resources |
| a couple of columns | table name + project | resources | name, type, location, resourceGroup, tags |
| all columns except | table name + project-away | resources | project-away id, tenantId, subscriptionId, plan, managedBy |
There are more available options for project-like operators. Check Microsoft Learn for these capabilities.
The take operator
This simple yet helpful operator enables KQL to return the top x records. For example, if you want to see the top 10 records from the resources table, you use the following KQL query.
resources
| take 10
The take operator can also be combined with the where operator, so the below query is also valid.
resources
| where location == 'northeurope' or location == 'westeurope'
| take 10
| project name, location, resourceGroup, type, tags
The where operator
With the where operator, you can filter the data in a table. Just like you would expect, you can combine it with and and or operators. However, an advantage over T-SQL is having multiple where operators in the same KQL query. This makes testing complex queries with many filters easier than SQL queries.
The KQL query below is totally valid:
resources
| where subscriptionId == 'xxxxxxxx-xxxx-xxxx-xxxx-xxxxxxxxxxxx'
| where resourceGroup == 'rg1'
| where location == 'northeurope' or location == 'westeurope'
| project name, location, resourceGroup, type, tags
Let’s look at several other useful operators when exploring the current tags.
The isnull() operator
If you want to locate resources without tags, you can use a query with the isnull() operator.
resources
| where isnull(tags)
Additionally, you can use filters for subscriptions, resource groups, resource types, etc. This gives some scope and makes it easier to find inconsistent tags for different solutions, environments, etc.
Note: the isnotnull() operator also exists, so that can be useful as well.
The contains operator
This operator is handy when you want to find similar-looking strings. For example, if you want to find all the resources in the westeurope and northeurope datacenters, instead of constructing a where clause with both datacenters, you can also use the contains operator to catch them both with a single where operator.
In other words, the query below:
resources
| where location contains 'europe'
| where isnull(tags)
is more straightforward to construct and shorter than:
resources
| where location == 'westeurope' or location == 'northeurope'
Another example where the contains operator is helpful is when tags are written with inconsistent capitalization. As mentioned in the introduction of this blog, ‘dev‘, ‘Dev‘, and ‘DEV‘ are all different values and a query with “where environment == 'dev‘” does not give you the other variants. However, by using the contains operator, the resultset does give you the resources for all different writings. This can be a lifesaver when bringing more structure to your resource tags!
// Just the resources with environment tag written as 'dev'
resources
| where tags.environment == 'Dev'
| project name, location, resourceGroup,type, tags
The above query gives all resources with a environment tag with the value ‘dev‘. The resultset can look like below.

But if you want to have the development resources with the environment tag in different writing, you can use the contains operator.
// The resources with environment tag written as 'dev'
resources
| where tags.environment contains 'dev'
| project name, location, resourceGroup, type, tags
This query does the job!
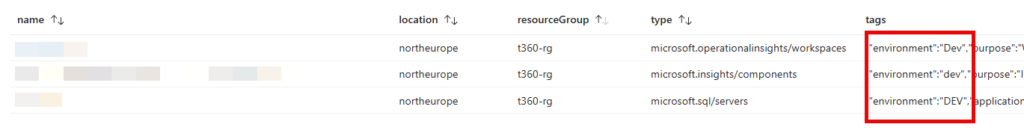
Besides searching for values in the tags array, you can also use it to find specific elements, even when they are written inconsistently. If you want to find resources that have a CostCenter tag, which might appear in different writing styles (‘costcenter’, ‘Costcenter’), you can use queries like:
resources
| where tags contains 'CostCenter'
| project name, location, resourceGroup, type, tags
This returns resultsets like:

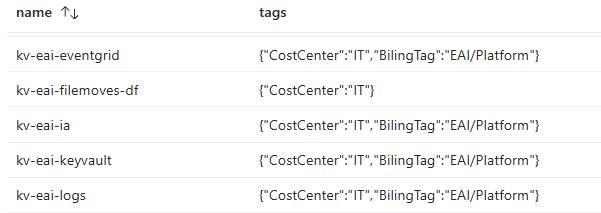
The has operator
When you check the tags in the above screenshot, you see that the tags of a resource are stored as an array. We have already seen that you can filter with queries like where tags.environment == 'dev', etc.
With the has operator, you can check the existence of elements in an array. For example, if you want to query resources that have a environment tag, you use the following query.
resources
| where tags has 'environment'
If you want to understand what resources do not have an environment tag, the query is as follows.
resources
| where tags !has 'environment'
The mvexpand operator
Until now, we have seen that you can get a good overview of your current resource tags by using a couple of operators and using them smartly with your queries. With the mvexpand operator, you can stretch that even further.
We have seen that the tags are stored as an array. With the mvexpand operator, you can expand the tags array or any other array you run into. After expanding the tags, it will be easier to query the tags and their values because a new record will be created for each tag of a resource. Let’s see what this looks like.
The below query shows each resource once, and their tags show up as an array:
resources
| project name, tags
This is how the output can look like. All resource tags appear as an array in the tags column
Next, let’s expand the tags array with the following query:
resources
| mvexpand tags
| project name, tags
Now, for each tag of a resource, a new record is created, and the output looks like this:

As you can see, each tag and its value now appear as pairs in the tags columns, making it easier to understand what tag/value pairs exist for each resource. With the extend operator, which we discuss in the next section, we will improve that visibility even more, so let’s move on.
The extend operator
This is another interesting operator. It enables you to create calculated columns and append them to your resultset. For tagging, this means that tag keys and tag values can have their own columns in the resultset, making it even easier to query for them.
We’ll show you an example of such a query.
resources
| mvexpand tags
| extend tagKey = tostring(bag_keys(tags)[0])
| extend tagValue = tostring(tags[tagKey])
| project name, tagKey, tagValue
In the above query, we first expand the tags array, giving each tag of a resource a row in the resultset. Then, we create a tagKey and a tagValue column and take their values from the tags array. Finally, we add the tagKey and tagValue to the projection.
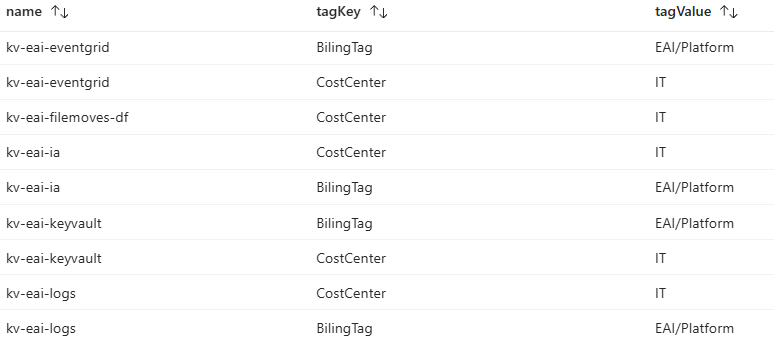
By combining the mvexpand operator and the extend operator, we made the tag keys and values easier to query and report, which helps you better understand the tags currently applied to your resources.
The count operator
If you want to understand, for example, how many resources do not have a specific tag or don’t have any tags at all, you can use the count operator. Examples include:
// Count the number of resources without any tags
resources
| where isnull(tags)
| count
or
// Count the number of resources without the environment tag
resources
| where tags !has 'environment'
| count
The summarize operator
The summarize operator serves to aggregate the content of an input table. For example, if you want to understand the number of resources per resource type, you can use the following query.
// Summarize resources per resource type
resources
| summarize count(type) by ['type']
You can make the query more useful by filtering on, for example, resource groups and resources that miss the environment tag and then sorting the count. Such a query looks like:
// Count and sort resources by type and filter on resource group and missing 'environment' tag
resources
| where resourceGroup == 'rg1'
| where tags !has('environment')
| summarize count(type) by ['type']
| sort by count_type
If required, you can even create charts of the output generated by queries with the summarize operator. After running the above query, you can navigate to the Charts tab page and choose the chart type that is most convenient for you.

Exporting query output to Excel for further analysis
We have seen that running targeted queries provides useful insights into your Azure environment’s current tagging. To benefit most from the output of a detailed query, you might want to export the result to .csv format and proceed with the analysis in Excel.
Let’s follow the steps to create and run a detailed query. Then, we export the resultset to a .csv file, open it in Excel, and analyze it.
- Copy the following query and paste it as a new query in Graph Explorer.
// This query projects all fields from the resources table, expand keys and
// values from tags, skus, and identities, and show them as additional columns
resources
| mvexpand tags, sku, identity
| extend tagKey = tostring(bag_keys(tags)[0])
| extend tagValue = tostring(tags[tagKey])
| extend skuKey = tostring(bag_keys(sku)[0])
| extend skuValue = tostring(sku[skuKey])
| extend idtKey = tostring(bag_keys(identity)[0])
| extend idtValue = tostring(identity[idtKey])
| project id, name, type, tenantId, kind, location, resourceGroup, subscriptionId, managedBy, skuKey, skuValue, plan, idtKey, idtValue, zones, extendedLocation, tagKey, tagValue
2. Next, run the query and explore the results. If the resultset meets your expectations, click the Download as CSV button and the resultset will be downloaded.
3. Now, open the file in Excel. It looks something like below.
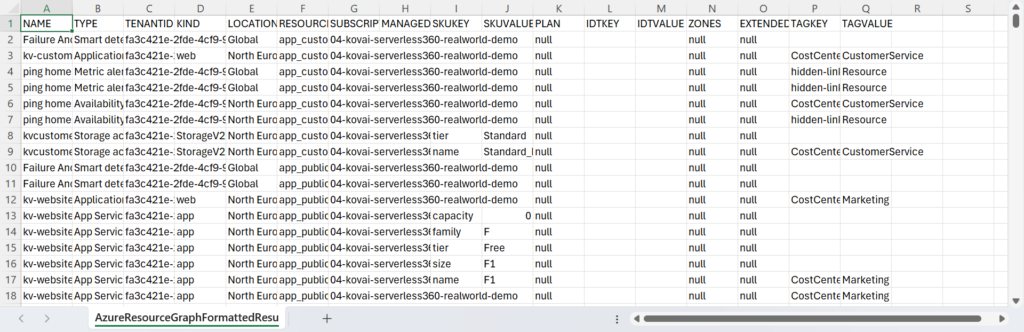
I always prefer to format Excel sheets by making the header row bold and underlined and ‘freezing’ it to ensure it remains visible when scrolling. Next, I make the data in the columns filterable by navigating the Data menu and clicking Filter; each column now has a dropdown menu that contains sort, filtering and selection options. When you also adjust the width of the columns, you have a good starting point for your analysis.

You can now easily filter on, for example, Resource Groups, Resource Types, Locations, etc., and understand how the tagging looks for all the resources.
Depending on your findings, you can make an action plan to ensure consistent tagging for all the resources in your Azure landscape.
Conclusion
Consistent and complete tagging is vital to effective resource management, cost control, and compliance in an extended Azure environment. Tools like Resource Graph Explorer and Kusto Query Language (KQL) allow you to quickly create an inventory of your Azure Resource Tagging, analyze the current state of your tags, identify gaps, and take corrective action. By exporting the resultsets of your queries for further analysis, you can make informed decisions and streamline your resource tagging strategy.
By leveraging KQL and Azure tools, you can turn your complex, untagged environment into a well-structured and manageable one.
Call to action
When you have created the inventory of resource tagging, there are several steps you can take. Think of:
- Enforce Tagging policies with Azure Policy
- Automate Tagging with deployment scripts
- Perform Regular Audits to ensure consistency
Further reading
Here you have some more resources for further reading: